Creating a Custom Extension
| ⚡ It may be helpful to use the Snail IDE Logger |
|---|
What is a Custom Extension?
A custom extension adds a new category and blocks to the toolbox (sidebar).
You create these using JavaScript, so you'll need at least a basic understanding of JavaScript to create one.
How do I load a Custom Extension?
Scroll to the bottom of the extensions menu and click "Custom Extension".
Currently the only way to test extensions without hosting them on a production server, is opening a local host with your JS code inside of it loading the URL. When loaded from http://localhost:8000/, extensions are automatically ran unsandboxed. Click here to learn how to do that.
As for what running an extension without a sandbox means,
Types of Custom Extensions
Custom extensions can be loaded with an extension sandbox or not.
The extension sandbox ensures the extension that the user is loading will never be able to do anything "too dangerous".
There are some key differences that may give you a reason to not use the sandbox though:
| Blocks run as fast as possible | Can access/modify the project | Can open pop-ups/new tabs | Have the ability to corrupt the project | Can access all custom extension features | |
|---|---|---|---|---|---|
| Sandboxed Extensions | ❌ | ❌ | ❌ | ❓ | ❌ |
| Unsandboxed Extensions | ✅ | ✅ | ✅ | ✅ | ✅ |
Generally its faster & more compatible to load extensions unsandboxed, though you can't load non-trusted URLs into the editor unsandboxed for security.
Project Uploading
You can't upload a Snail IDE project with a custom extension unless you have ranked up.
If you want to upload a project with your extension, you'll need to upload some other projects & wait a couple days since you first signed in before you can rank up.
Recommendations
As mentioned earlier, it is highly recommended that you have some knowledge of JavaScript.
This'll help you actually program things once your done here.
It is also recommended that you use a browser with Developer Tools enabled.
If you are using a mobile device or a device owned by an organization or school, you might not be able to access it.
You can access the Developer Tools with one of 3 methods:
- Right Click > Inspect element (or just Inspect)
- Ctrl + Shift + I (or Option + Command + I on MacOS)
- F12 (on most browsers)
The most useful tool in the Developer Tools is the Console tab, which can be changed at the top.
The Console tab will show errors or warnings coming from the page, or your extension.
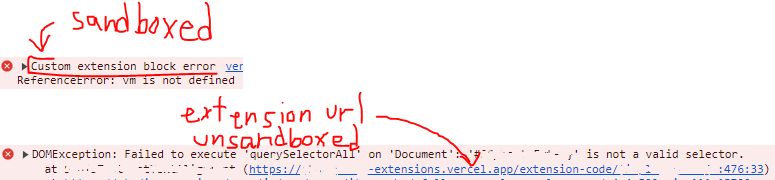
You can differentiate errors from your extension and errors from the website by looking at the link next to the error or warning.
- Errors coming from a custom extension loaded from URL
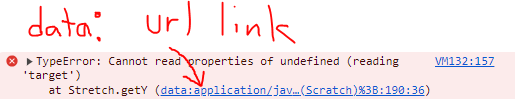
- Errors coming from a custom extension loaded from File or Text
Extra Support
You may have some unexpected errors or problems when developing extensions.
If you need any extra help, feel free to message Mr_rudy on scratch to ask any questions.
First Steps
Let's begin by creating a basic extension.